
World Debugging
You must have already downloaded the World debugger before you read this document. If you haven’t, do not worry. See: Debugger Download and Configuration to download the debugger. Let’s get started with the World debugger!
Start World Debugging
Open the World Debugger
- Open a Unity project and a scene to be tested.
- Make sure the ParaWorldRoot object exists in the scene.
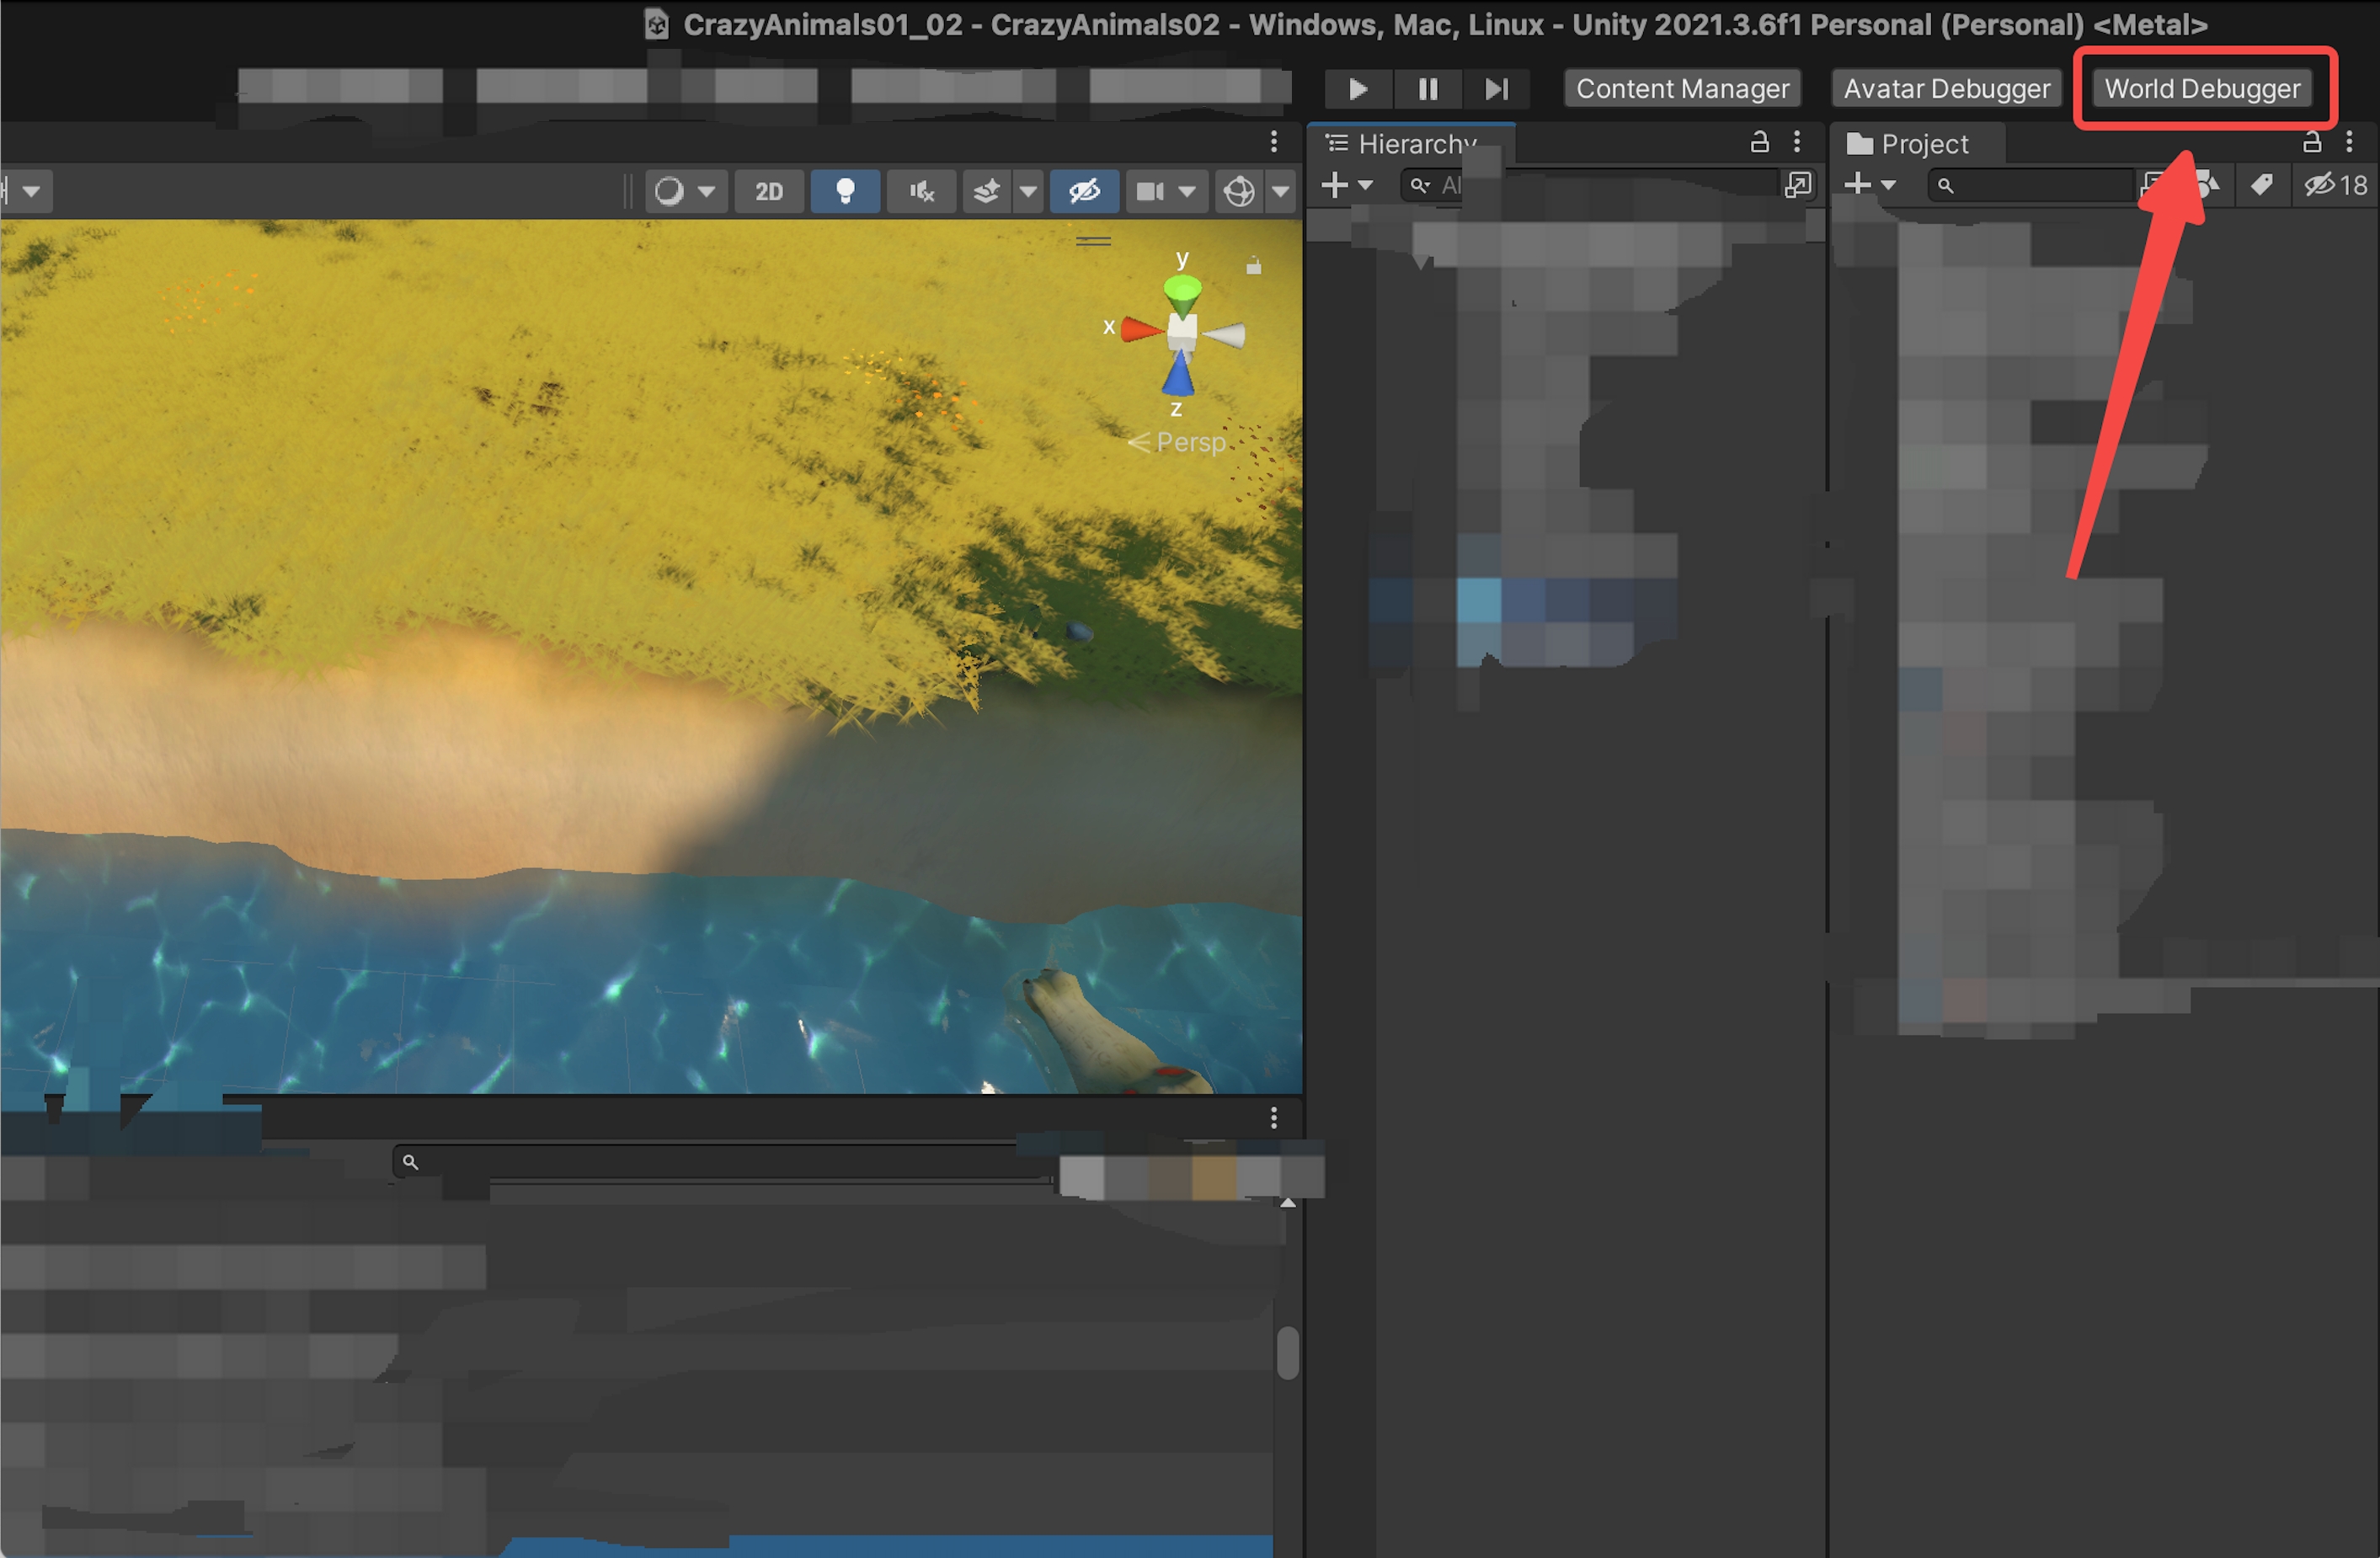
- Click the World Debugger button. A page pops up.
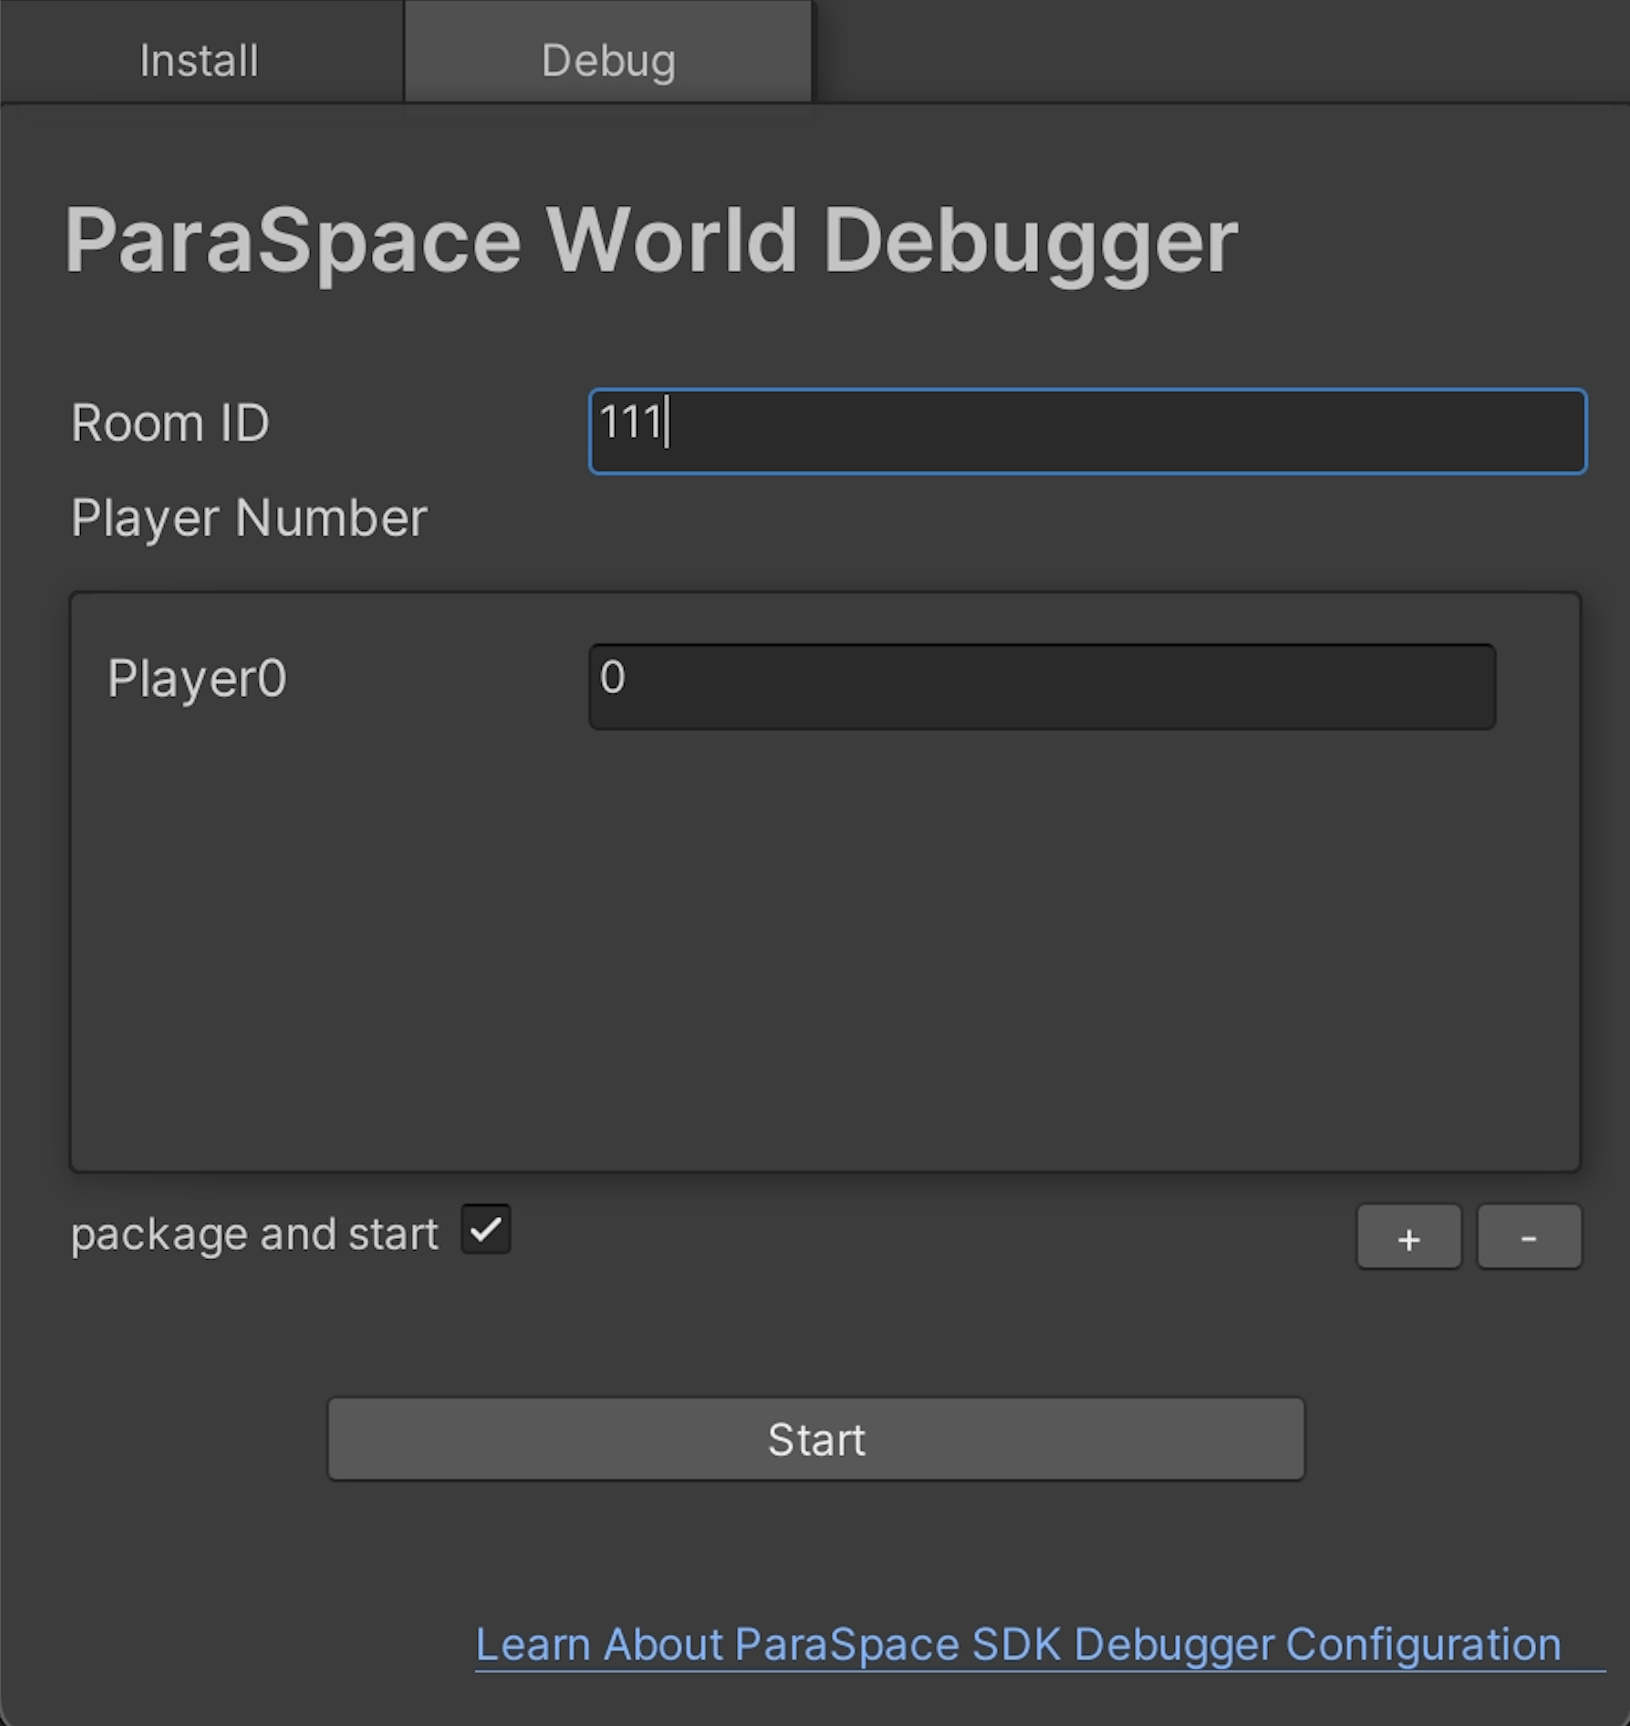
- On the Debug tab, enter a value for RoomID and Player Number. Then click Start to start scene packaging and launch the editor.
- RoomID: It can be any number or letter. If you want to debug on 2 computers that have the same project, you can enter the same room ID to enter the same World for debugging.
- Player Number: Enter the number of player clients you’d like to initiate for local debugging.
- PlayerX: Username after the player client is initiated locally.
If only the Lua code is modified and no scene resource modification is involved, the scene packaging is not required. Deselect the package and start option and directly click "Start" to start the simulator.
- Depending on your system type (Windows or Mac), the security and privacy prompt may be displayed when you start the simulator. For details, see Debugger Download and Configuration.
Debugger Features
To be compatible with keyboard operations, we have modified the control methods:
| Key | Description |
|---|---|
| W | Move forward |
| A | Move leftward |
| S | Move backward |
| D | Move rightward |
| Space | Jump |
| C | Crouch |
| Left key of mouse | Interact with the scene and UI |
| Right key of mouse | Rotate the camera after being pressed |
Compared with the features of the mobile platform, some of the World debugger features have been removed. However, most features are retained. And they are the same as the features of the mobile platform, which are not described here.
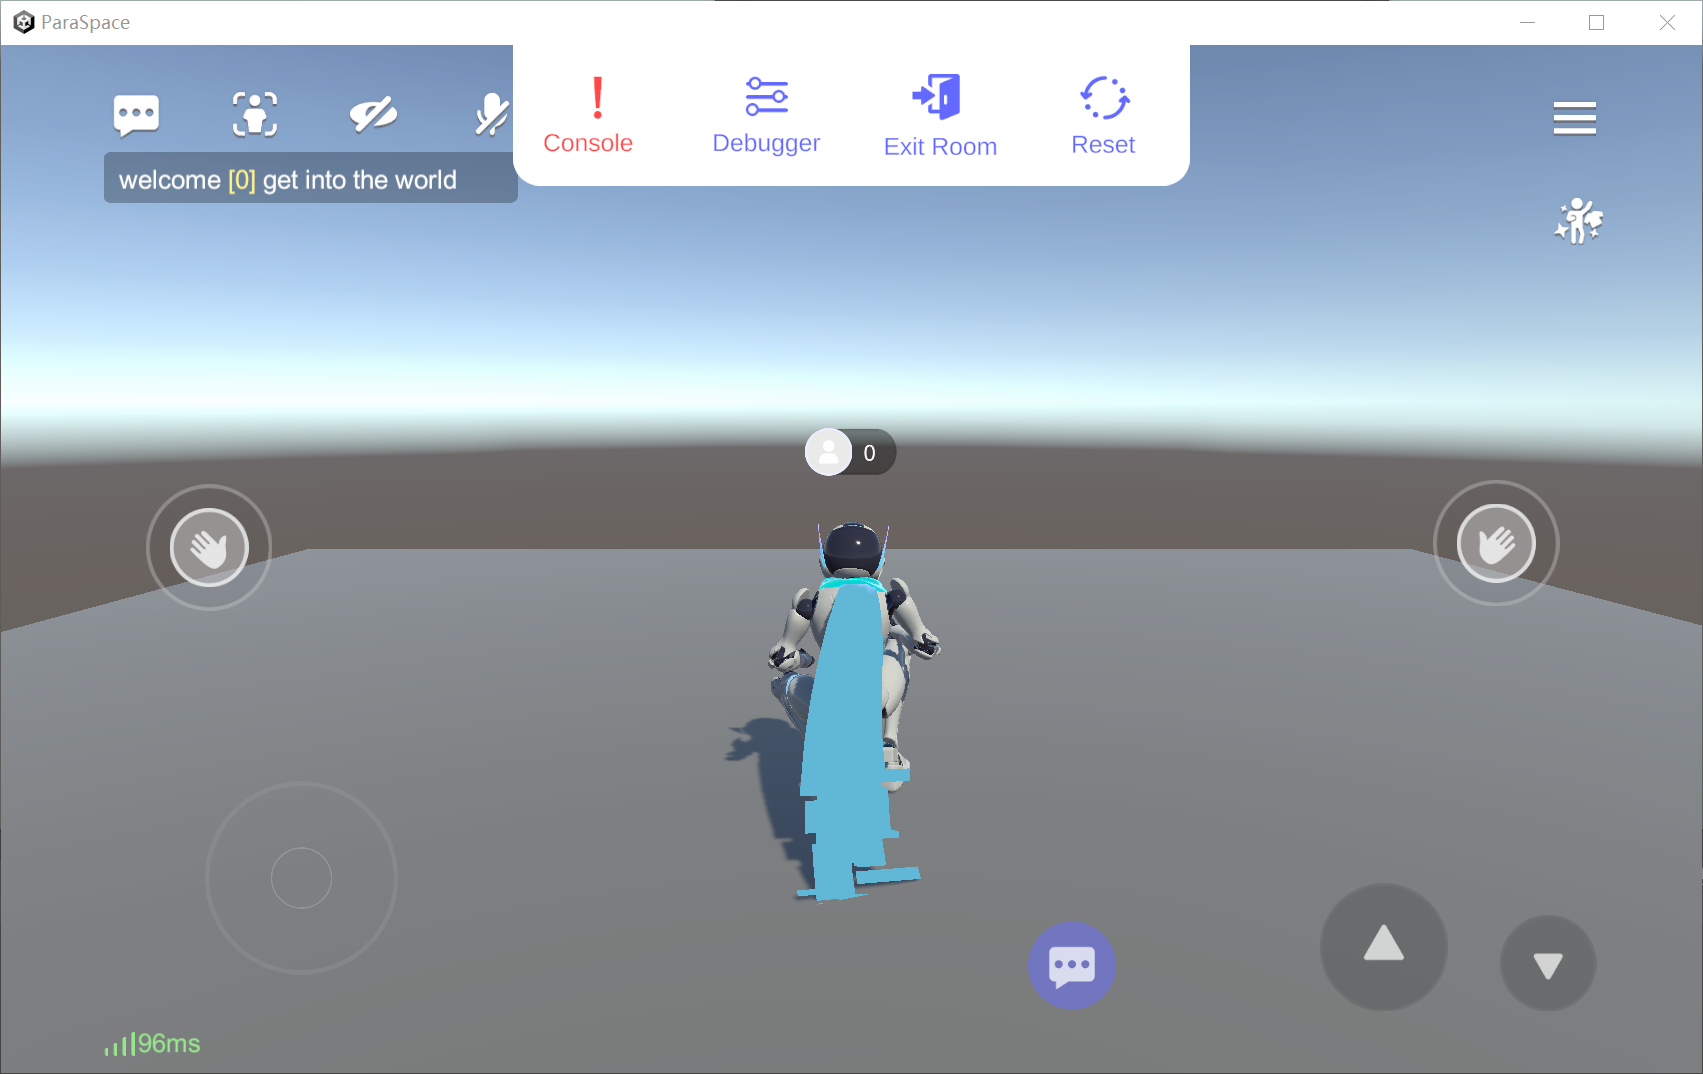
The following describes 3 special features of the World debugger. They are located at the upper center of the window.
Console
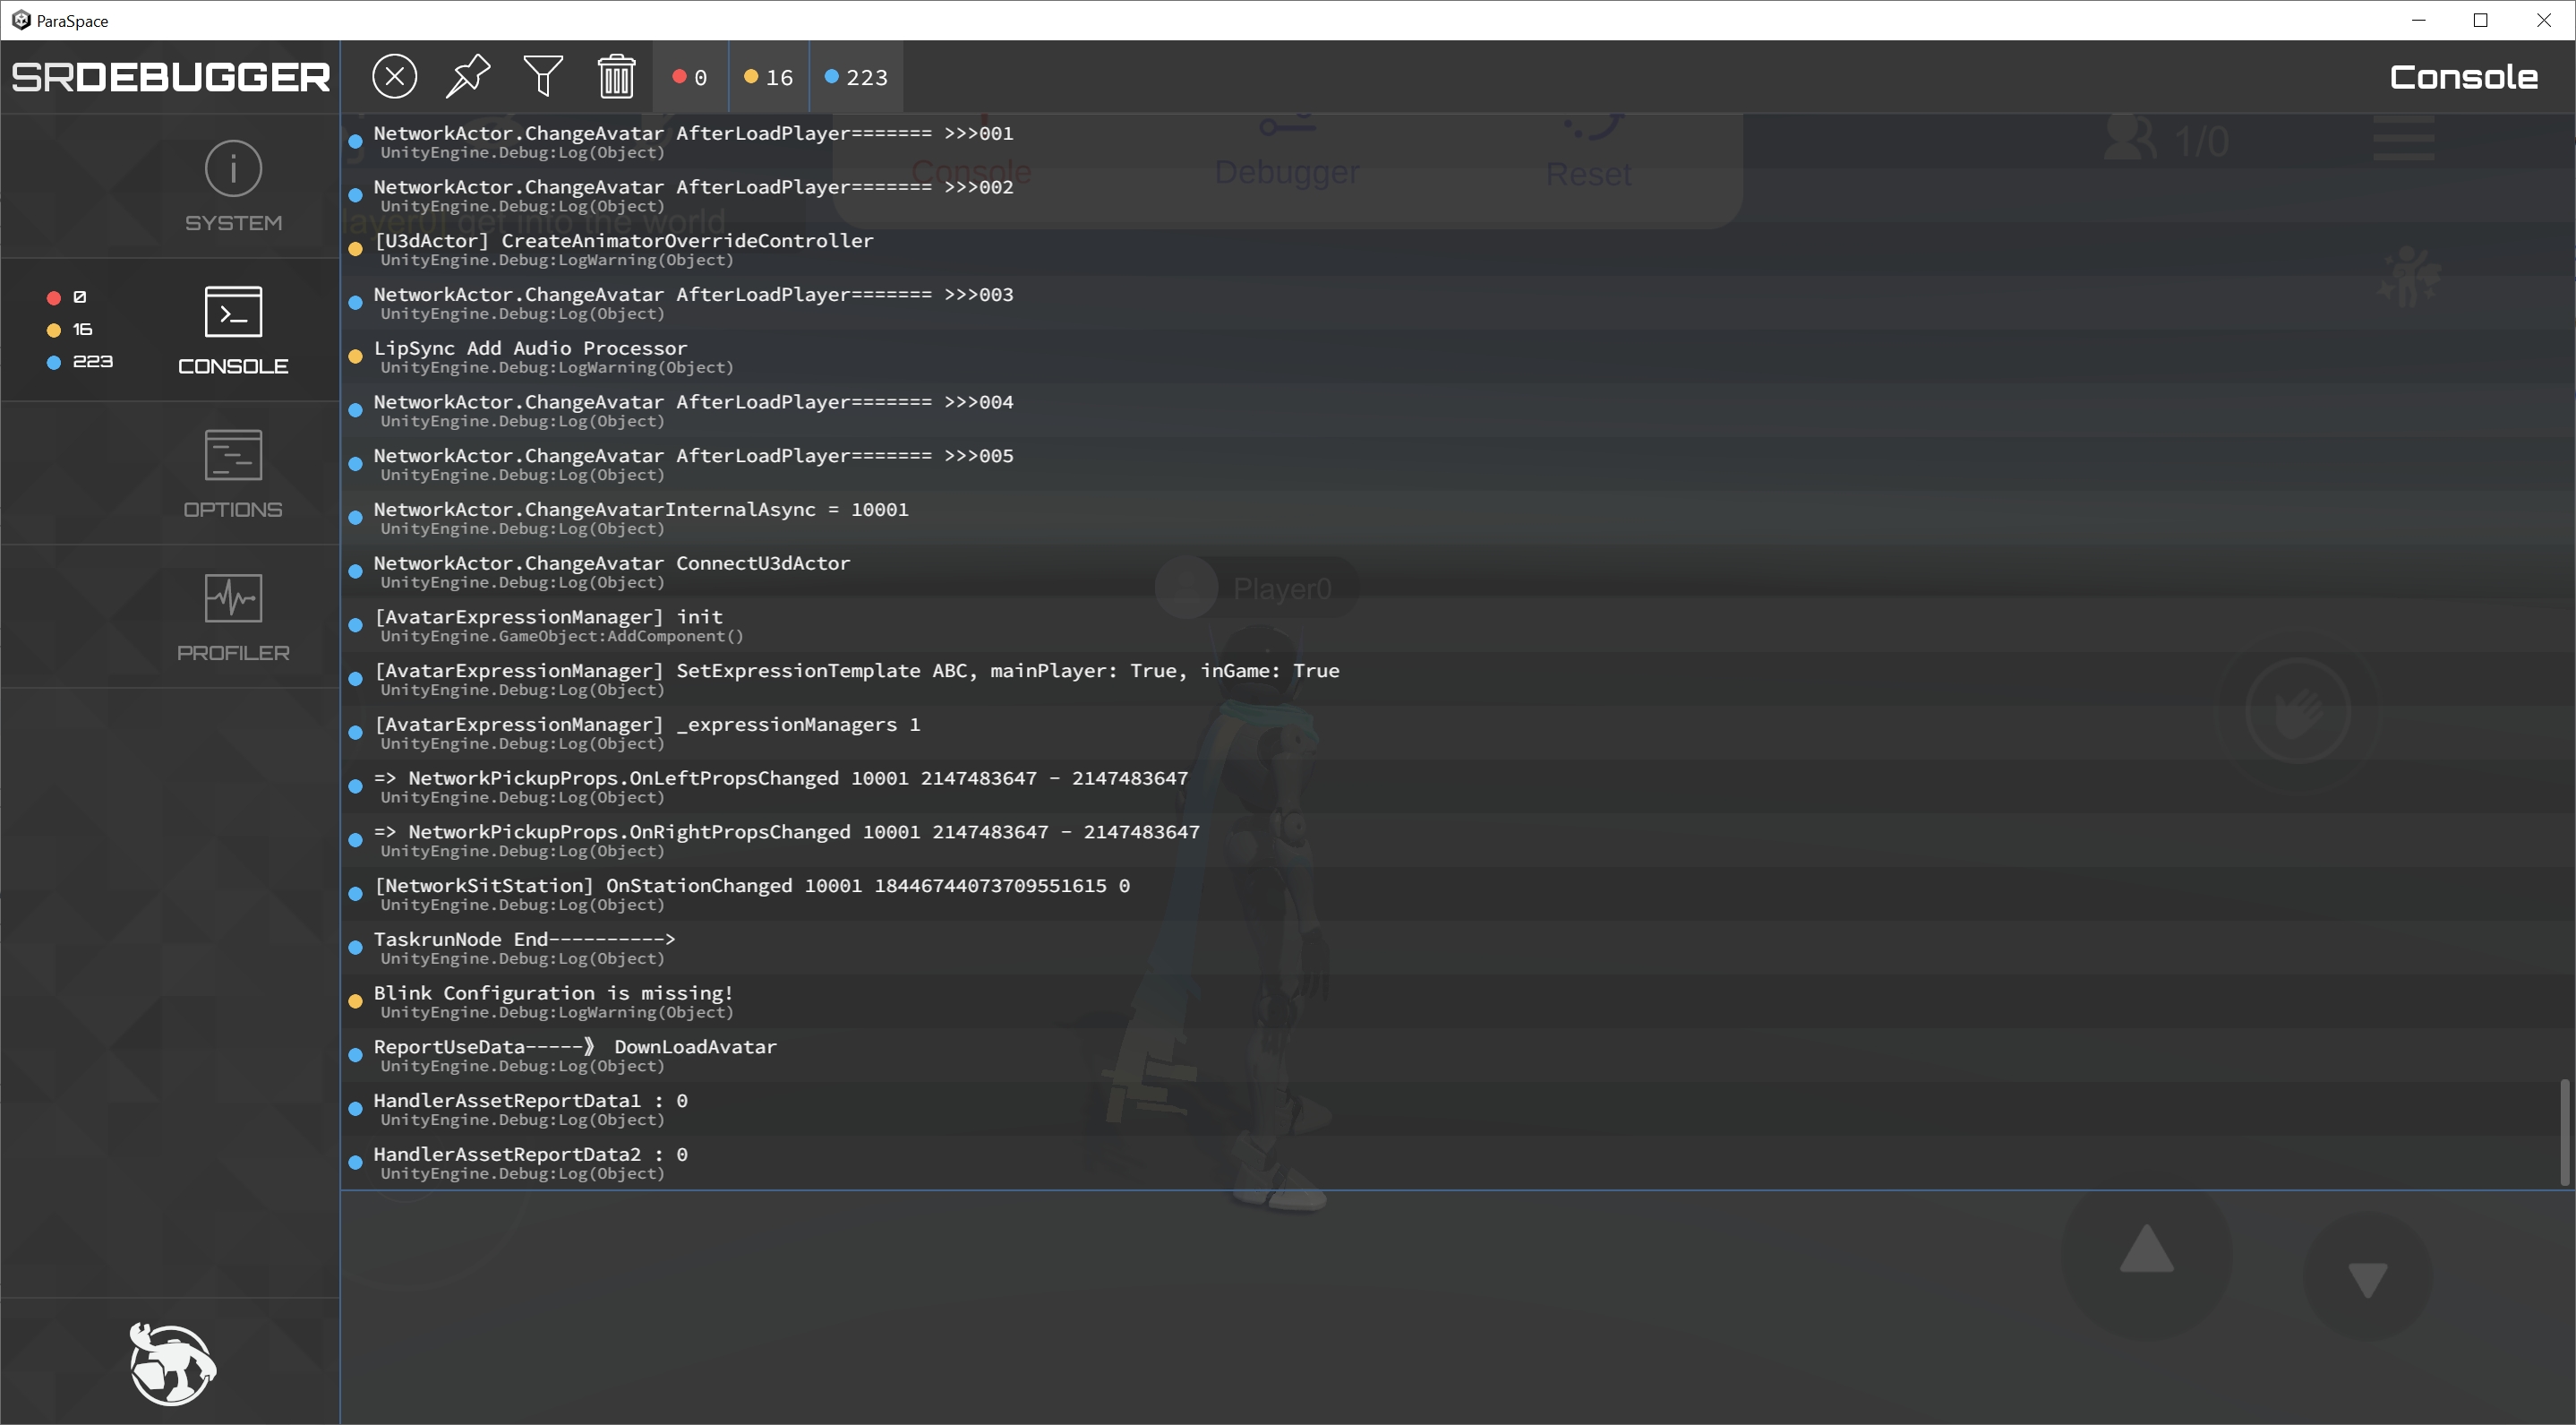
Click "Console" to open Unity’s console.
In the Console panel on the left, you can view all console prompts loaded for the scene. If any error occurs, you can view the error information of Unity to find the root cause.
Debugger
Click Debugger to open the scene’s node controller.
On the interface, you can view the information about all nodes in the scene and monitor and modify the parameters in their scripts.
- This is an advanced feature. If you make parameter changes suddenly, an error may occur to the scene.
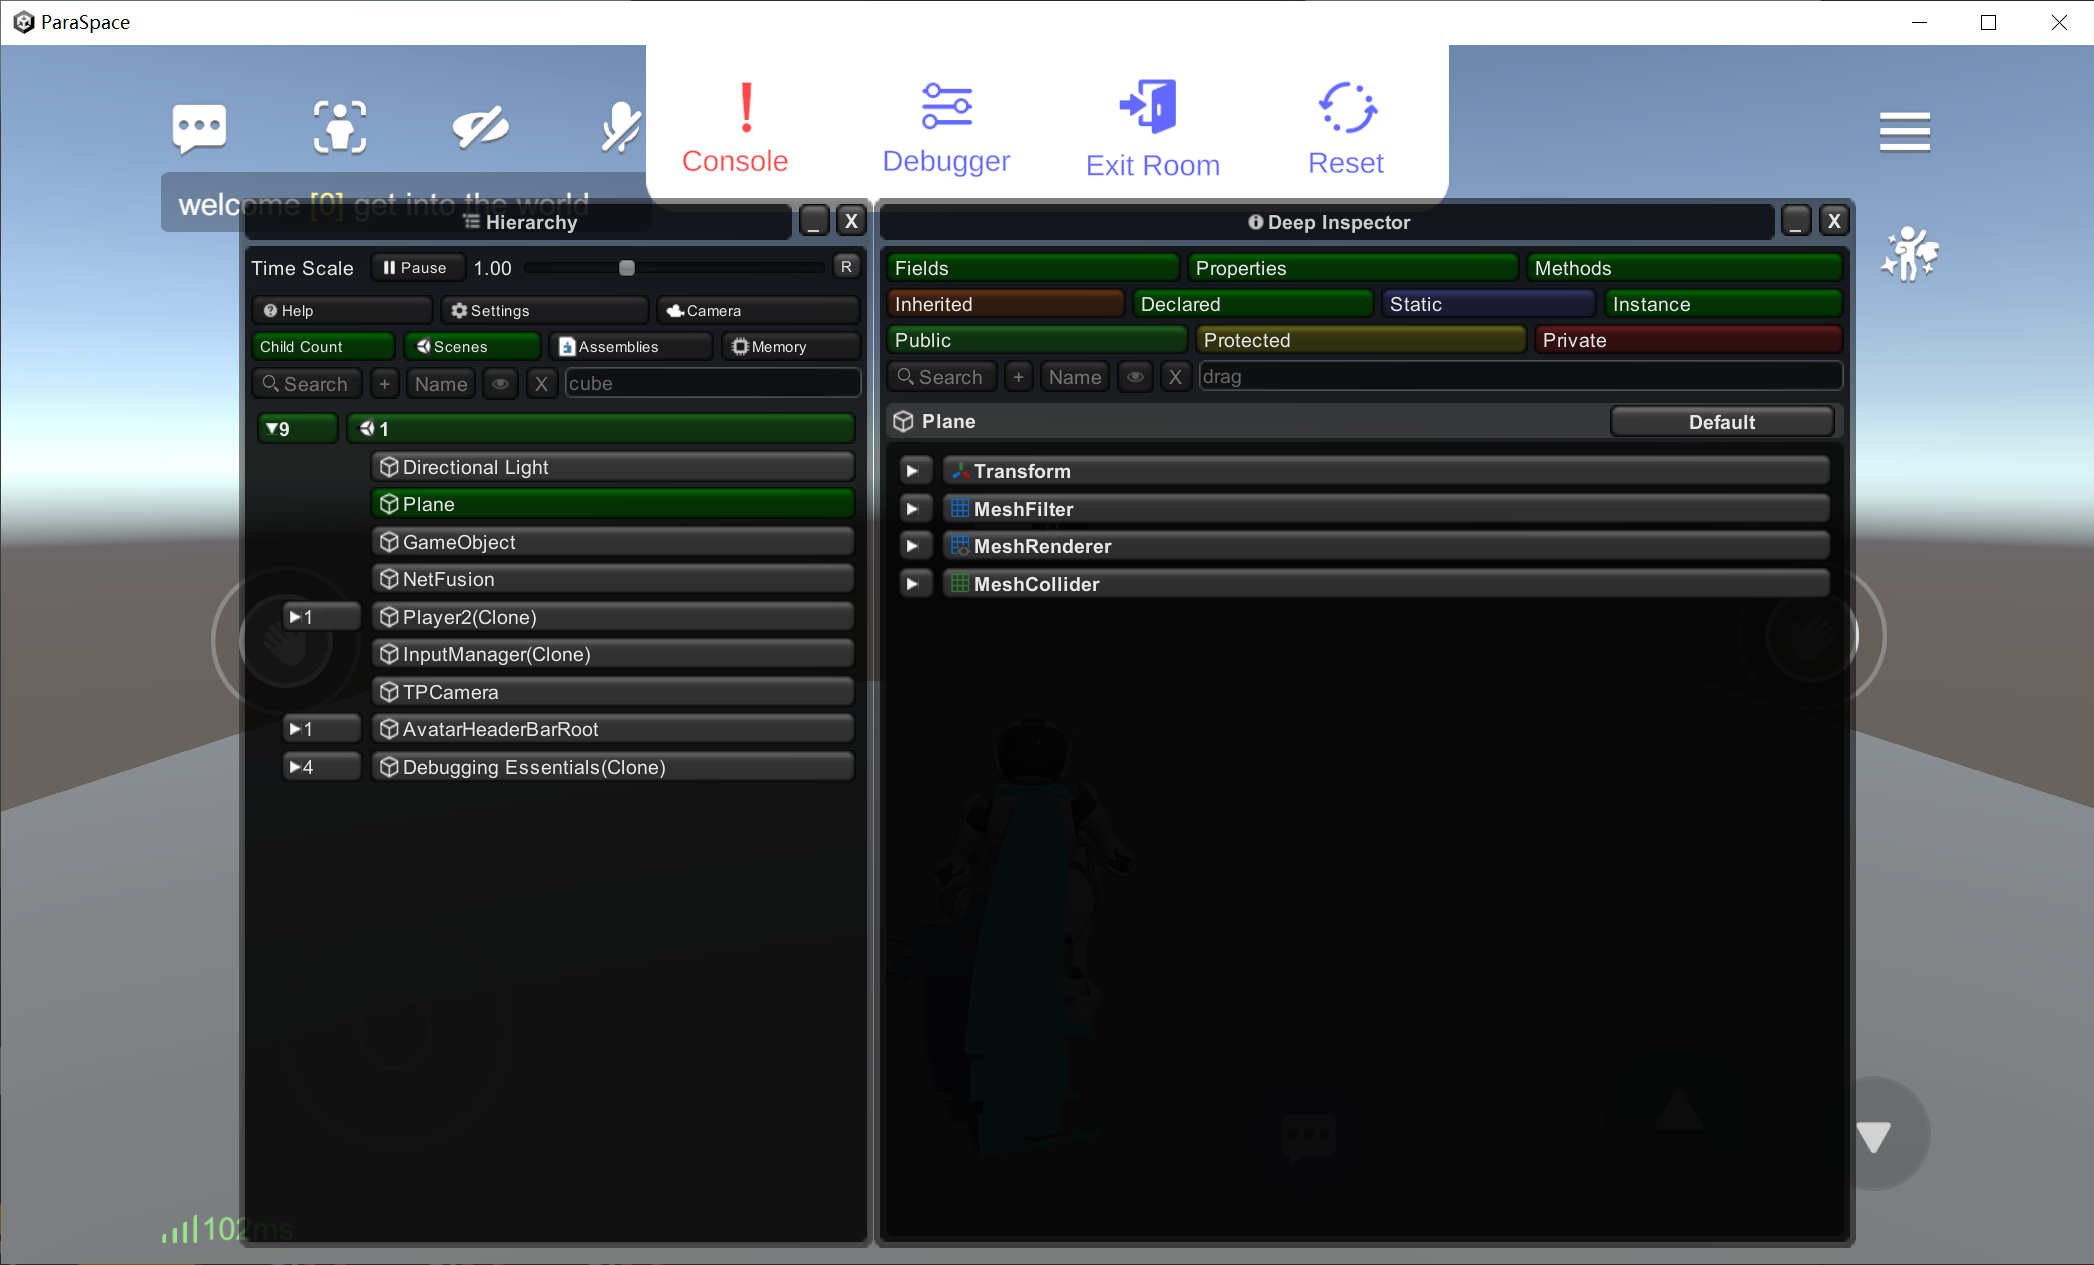
Exit Room
Click "Exit Room" to exit the current room. This makes it easier for creators to debug code.
Reset
The Reset feature, similar to that of the mobile platform, will restore your Avatar to the Spawn Point.
We hope that you have learned how to use the simulator after trying the above tutorial!
Updated about 1 year ago