
Avatar Debugging
To enable Avatar creators to create their Avatar assets in a better way, we provide an Avatar debugger that runs on PCs so that creators can directly view the creation result. If you haven’t downloaded and configured the debugger, see Debugger Download and Configuration to download and configure it first. If you have already downloaded it, let’s learn how to use the Avatar debugger together!
Start Avatar Debugging
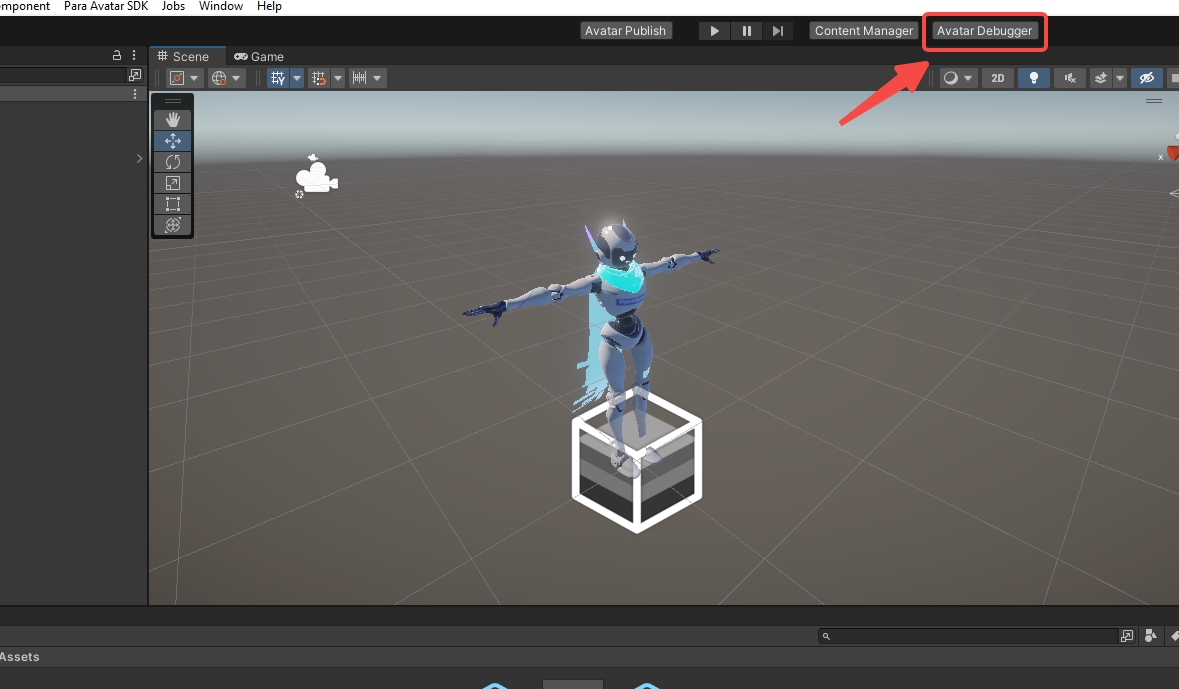
Open the Avatar Debugger
- Click the Avatar Debugger button.
Select an Avatar to Debug
- Open the Debug tab and configure the debugging environment.
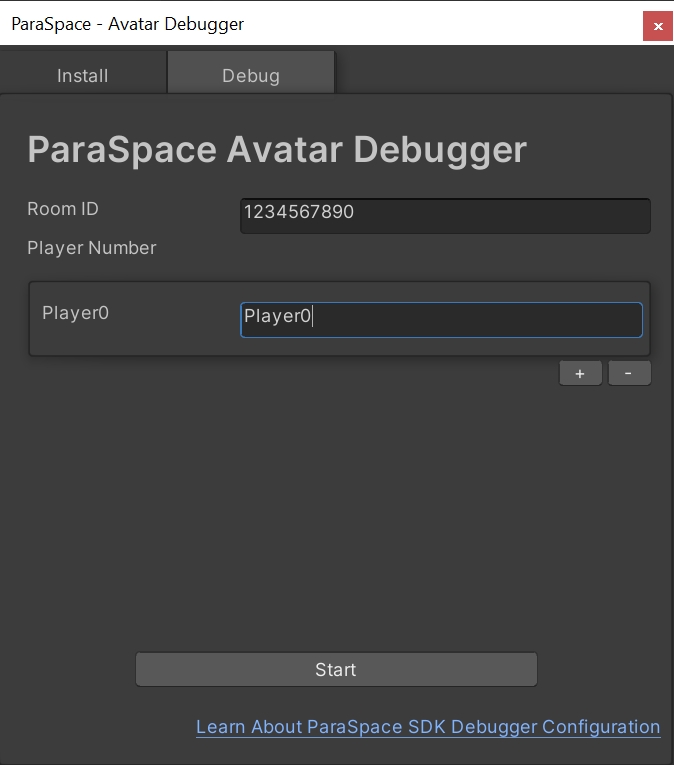
You need to configure 2 parameters and select the prefab of the Avatar that you need to debug (either in the Hierarchy panel or the Project panel). Then click the Start button to start debugging the Avatar.
| Parameter | Description |
|---|---|
| Room ID | The room ID of the scene that you debug. You can start multiple debuggers at the same time. As long as the ID is the same, you can load 2 Avatars. A room ID can contain numbers and English letters. |
| Player 0 | The name of the Avatar player in the scene that you debug. By default, this parameter is set to a number for determining the Avatar prefab controlled by you. |
You can click the button in the lower-right corner of the player to increase or decrease the number of players. Each player corresponds to a debugging window. Each window controls a player instance.
To start debugging, you must select the Avatar in the Project panel.You must select the prefab of the Avatar that you want to debug in the Project panel before you start running the Avatar debugger. Only in this way can the Avatar debugger debug the right Avatar. If your Avatar is adjusted in the Scene panel, drag and drop the Avatar object into the Project panel to create a prefab, and then click the prefab to start debugging. If you have already created a prefab and you have changed the Avatar object in the scene, remember to save those changes to the prefab.
Debugger Features
To be compatible with keyboard operations, we have modified the control methods:
| Key | Description |
|---|---|
| W | Move forward |
| A | Move leftward |
| S | Move backward |
| D | Move rightward |
| Space | Jump |
| C | Crouch |
| Left key of mouse | Interact with the scene and UI |
| Right key of mouse | Rotate the camera after being pressed |
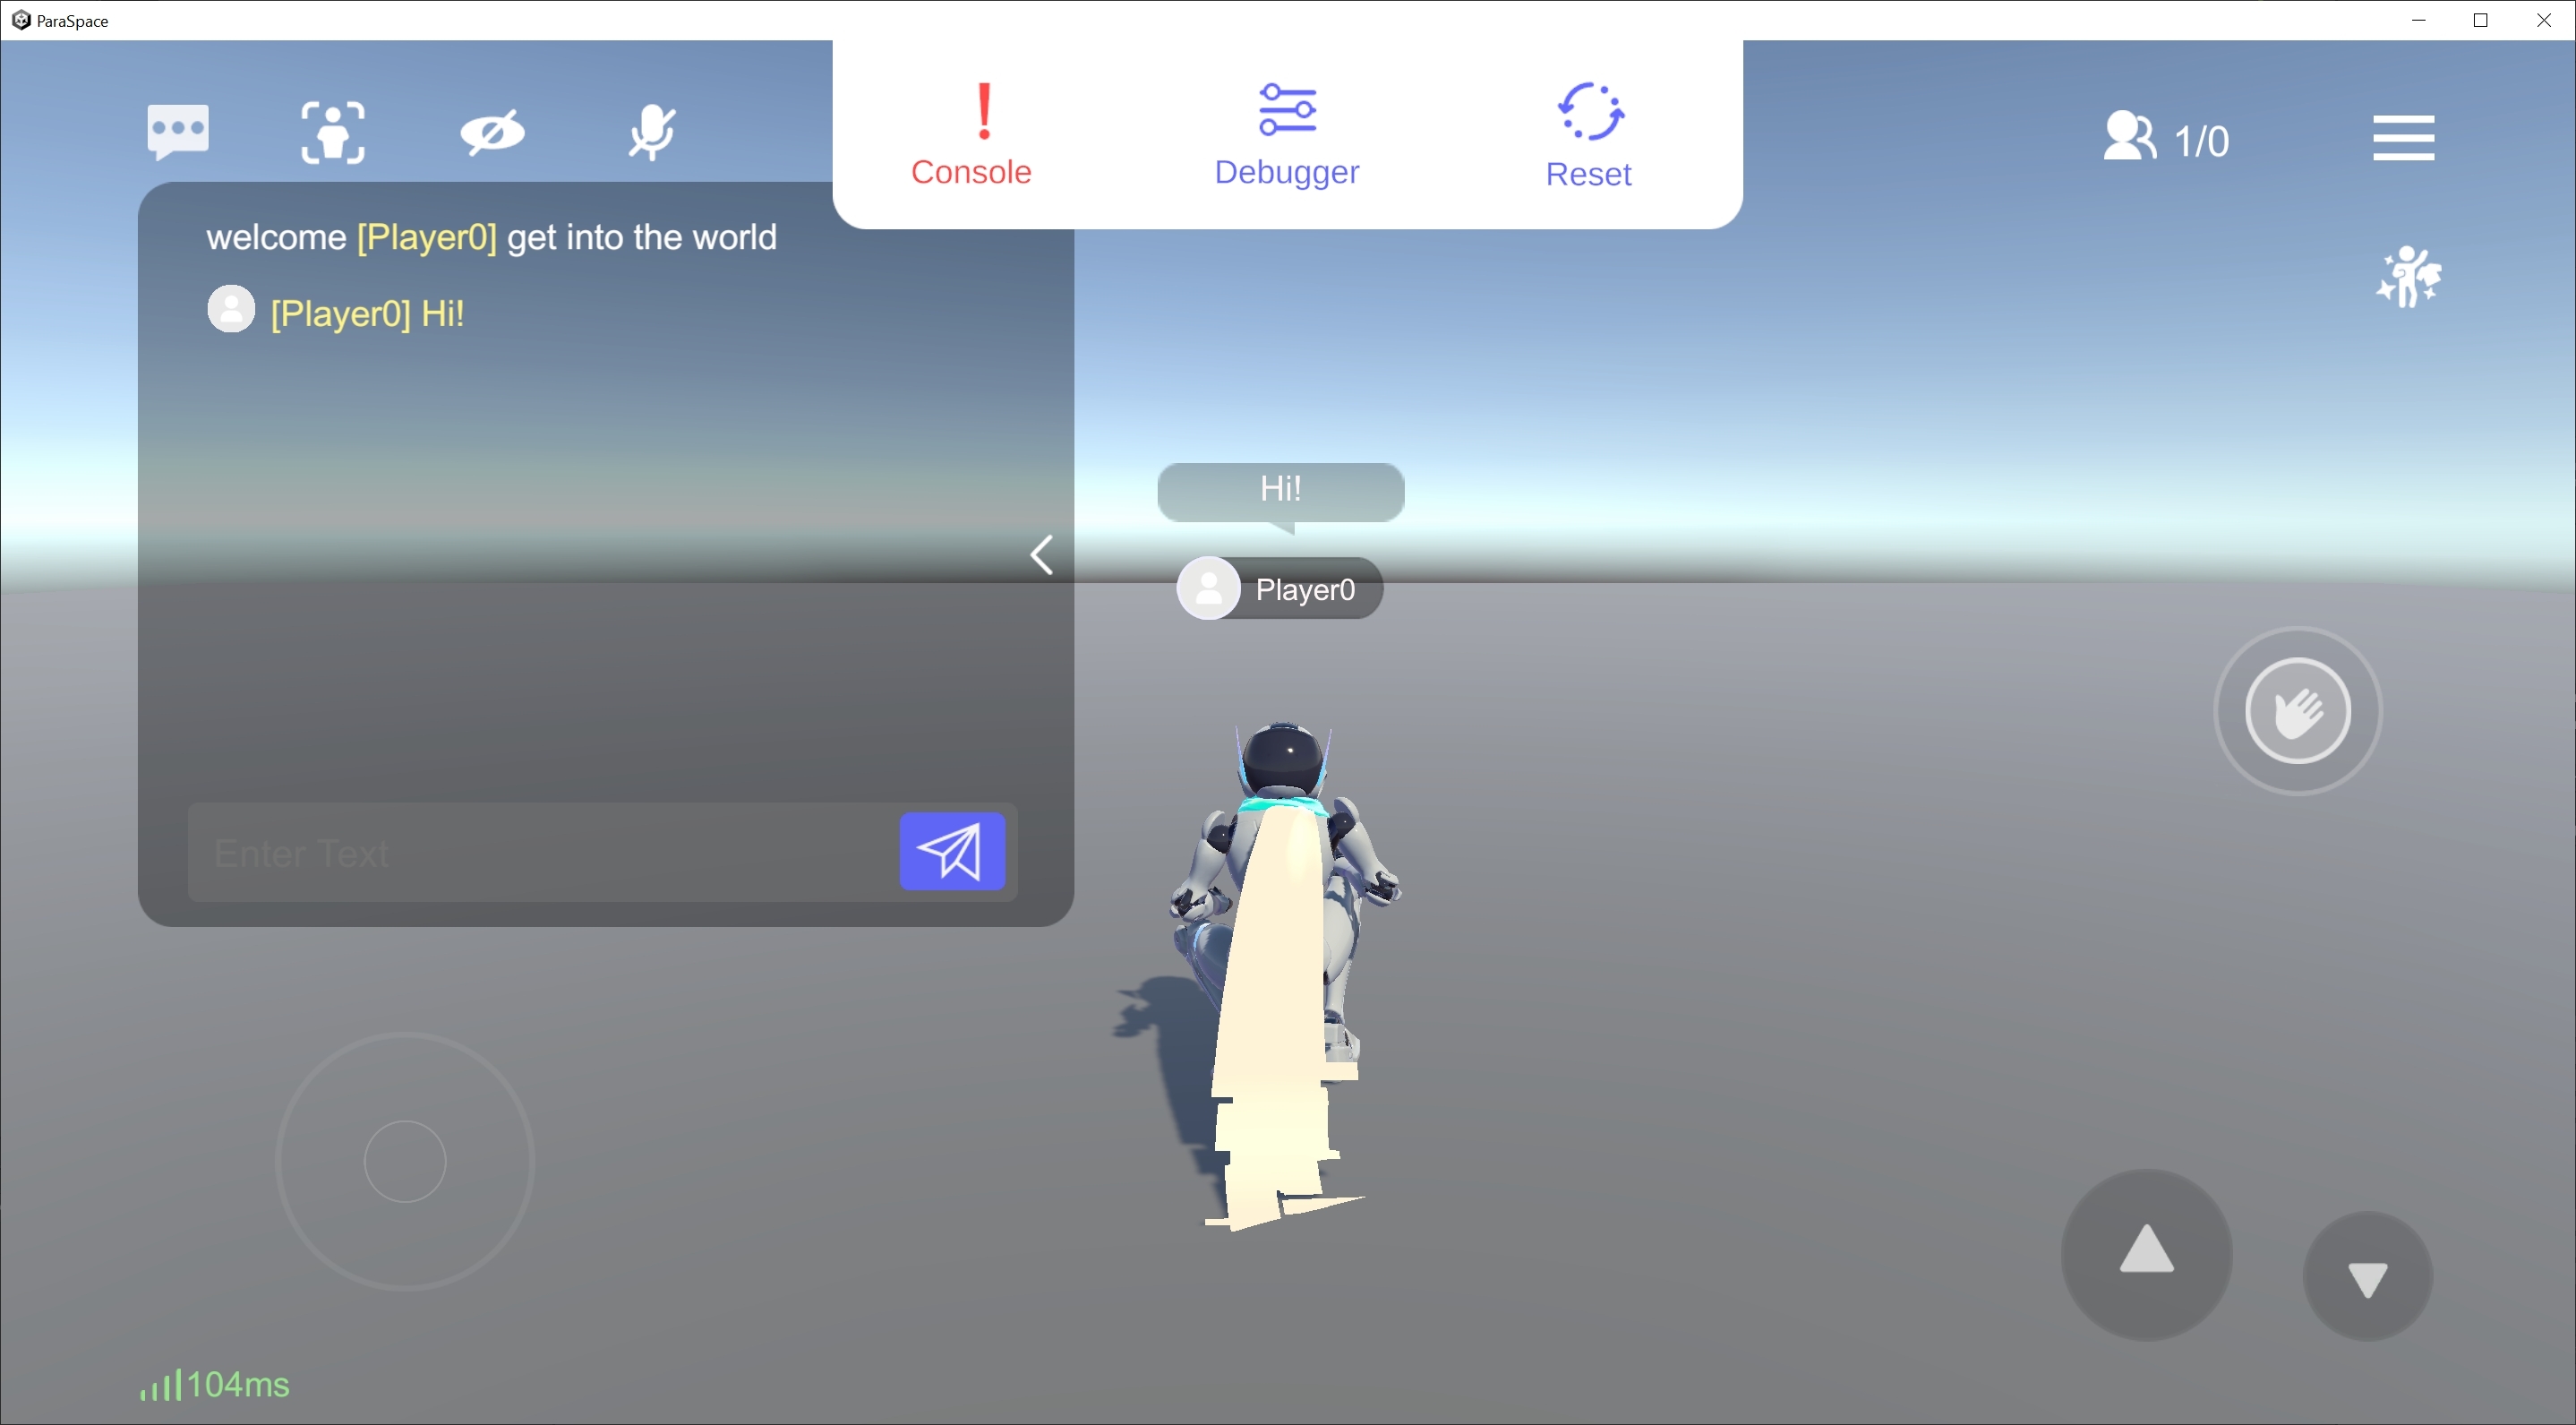
Compared with the features of the mobile platform, some of the Avatar debugger features have been removed. However, most features have been retained. And they are the same as the features of the mobile platform, which are not described here.
The following describes 3 special features of the Avatar debugger. They are located at the upper center of the window.
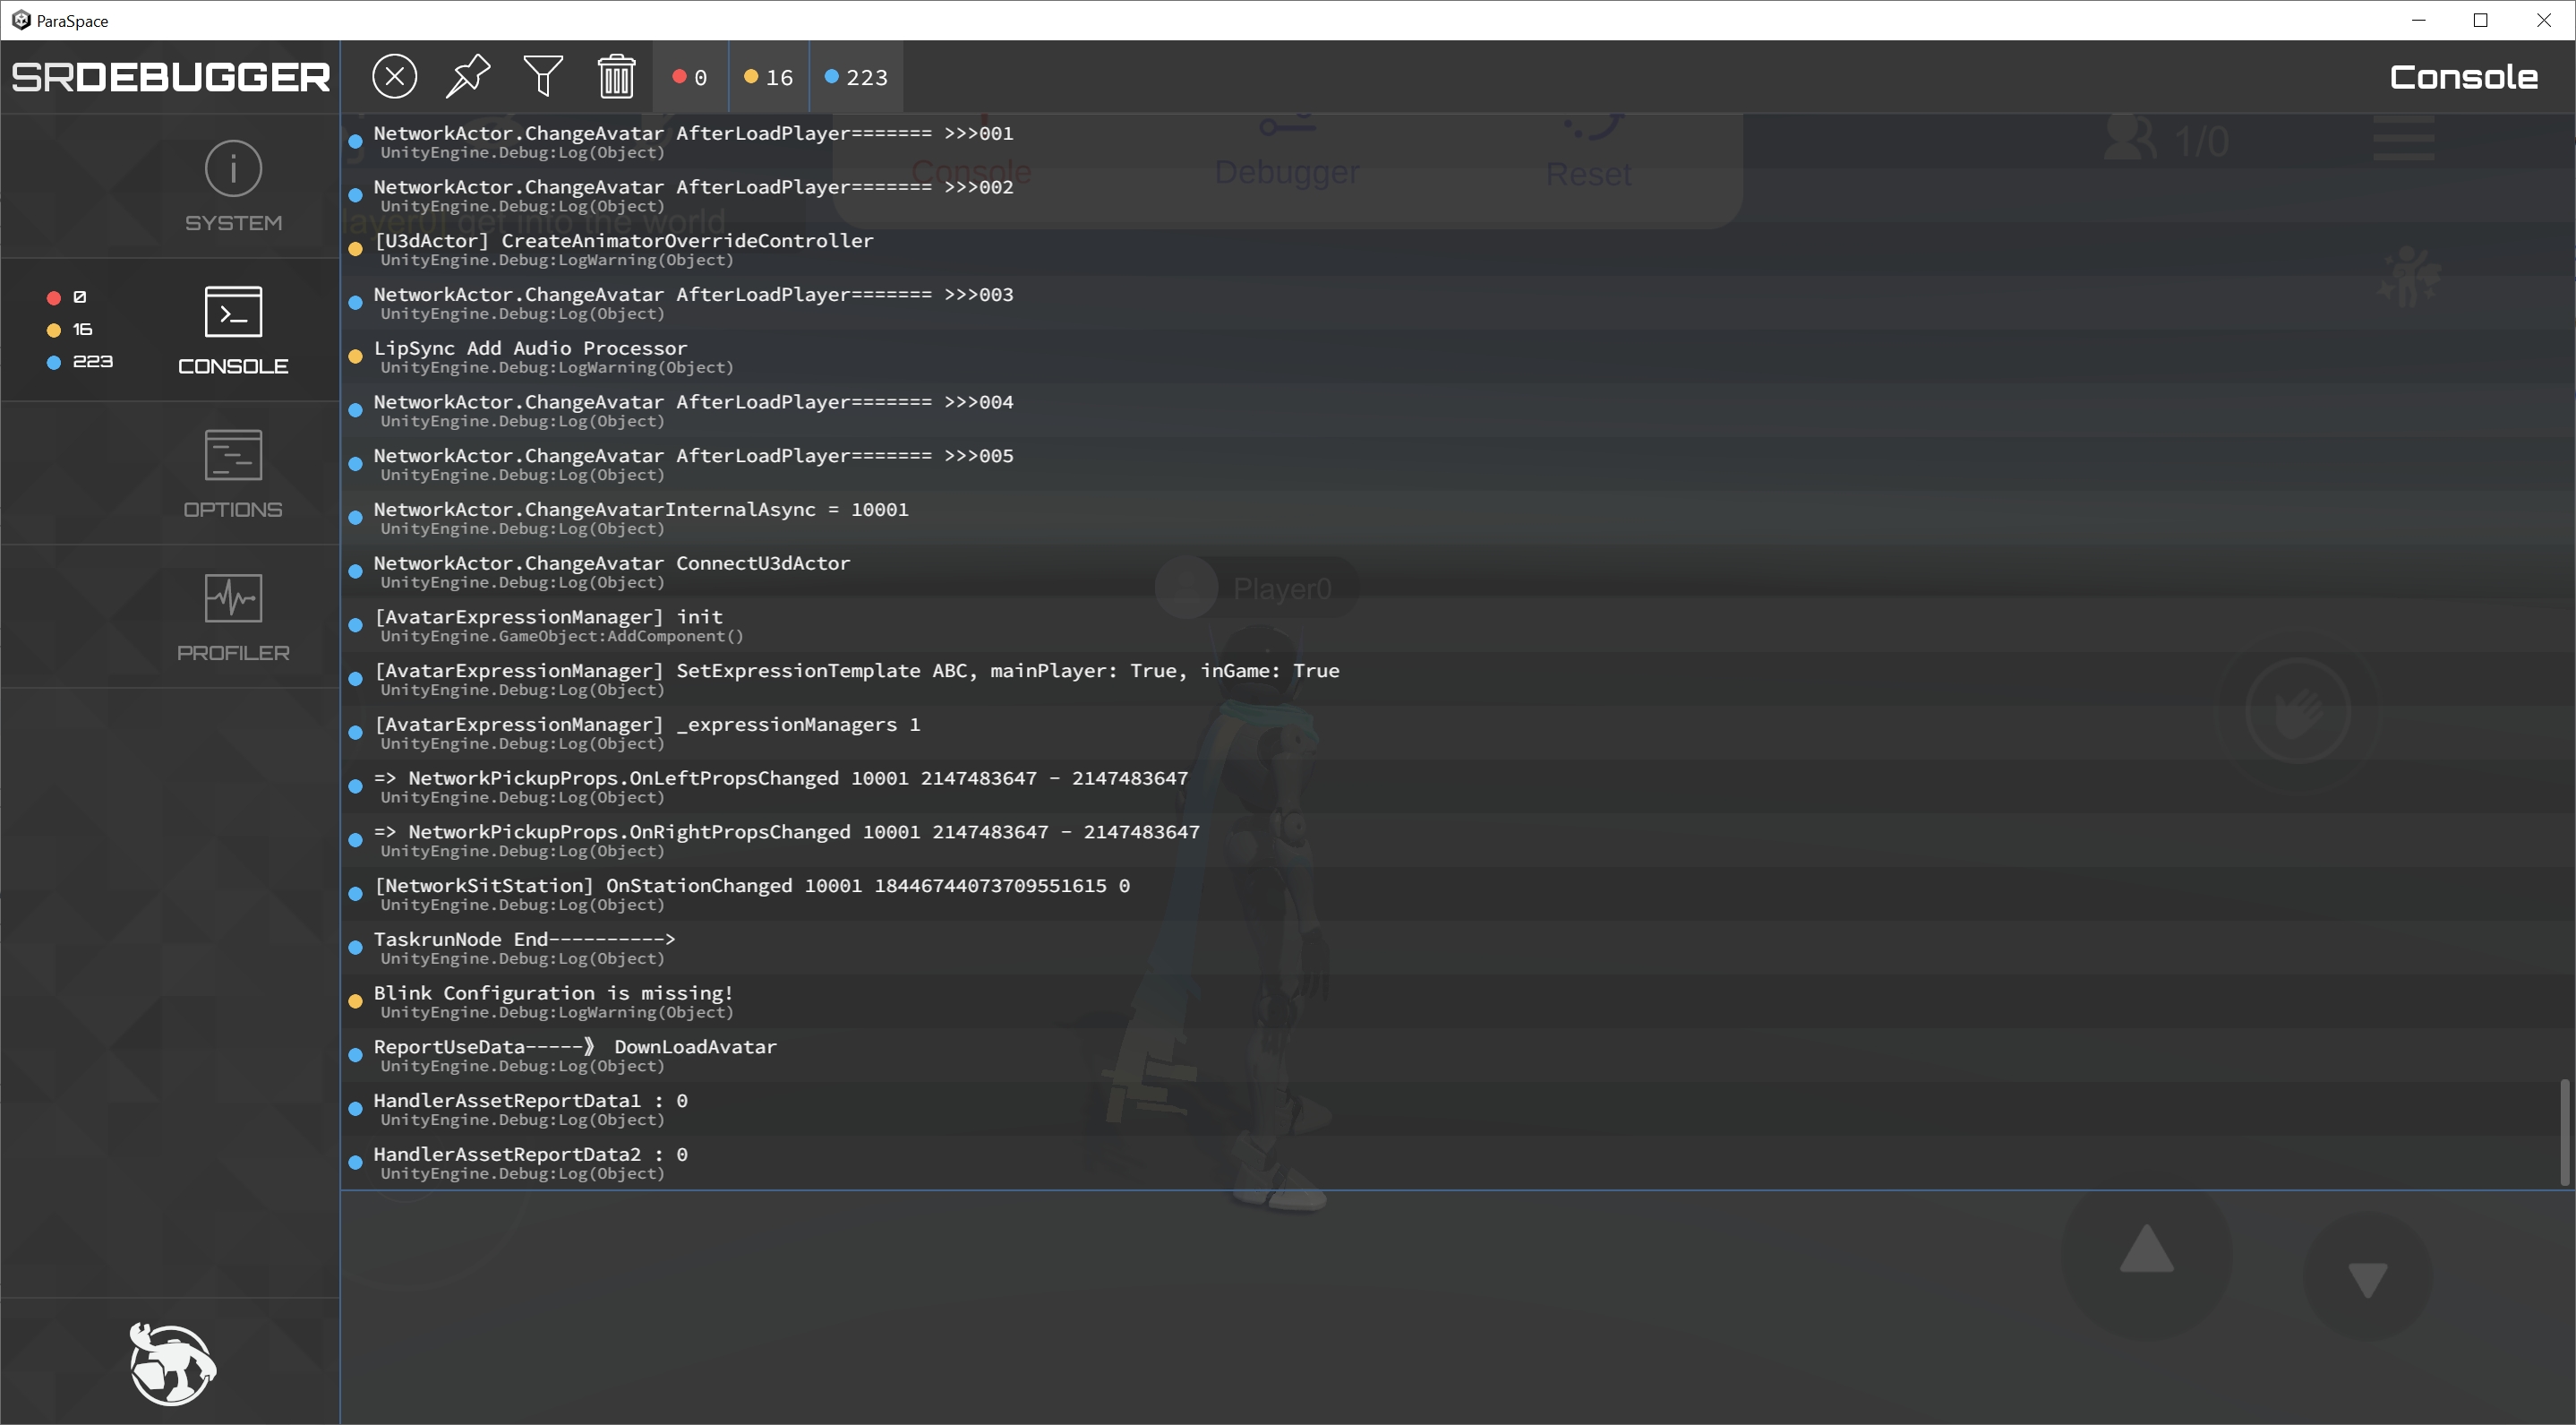
Console
Click Console to open Unity’s console.
In the Console panel on the left, you can view all console prompts loaded for the scene. If any error occurs, you can view the error information of Unity to find the root cause.
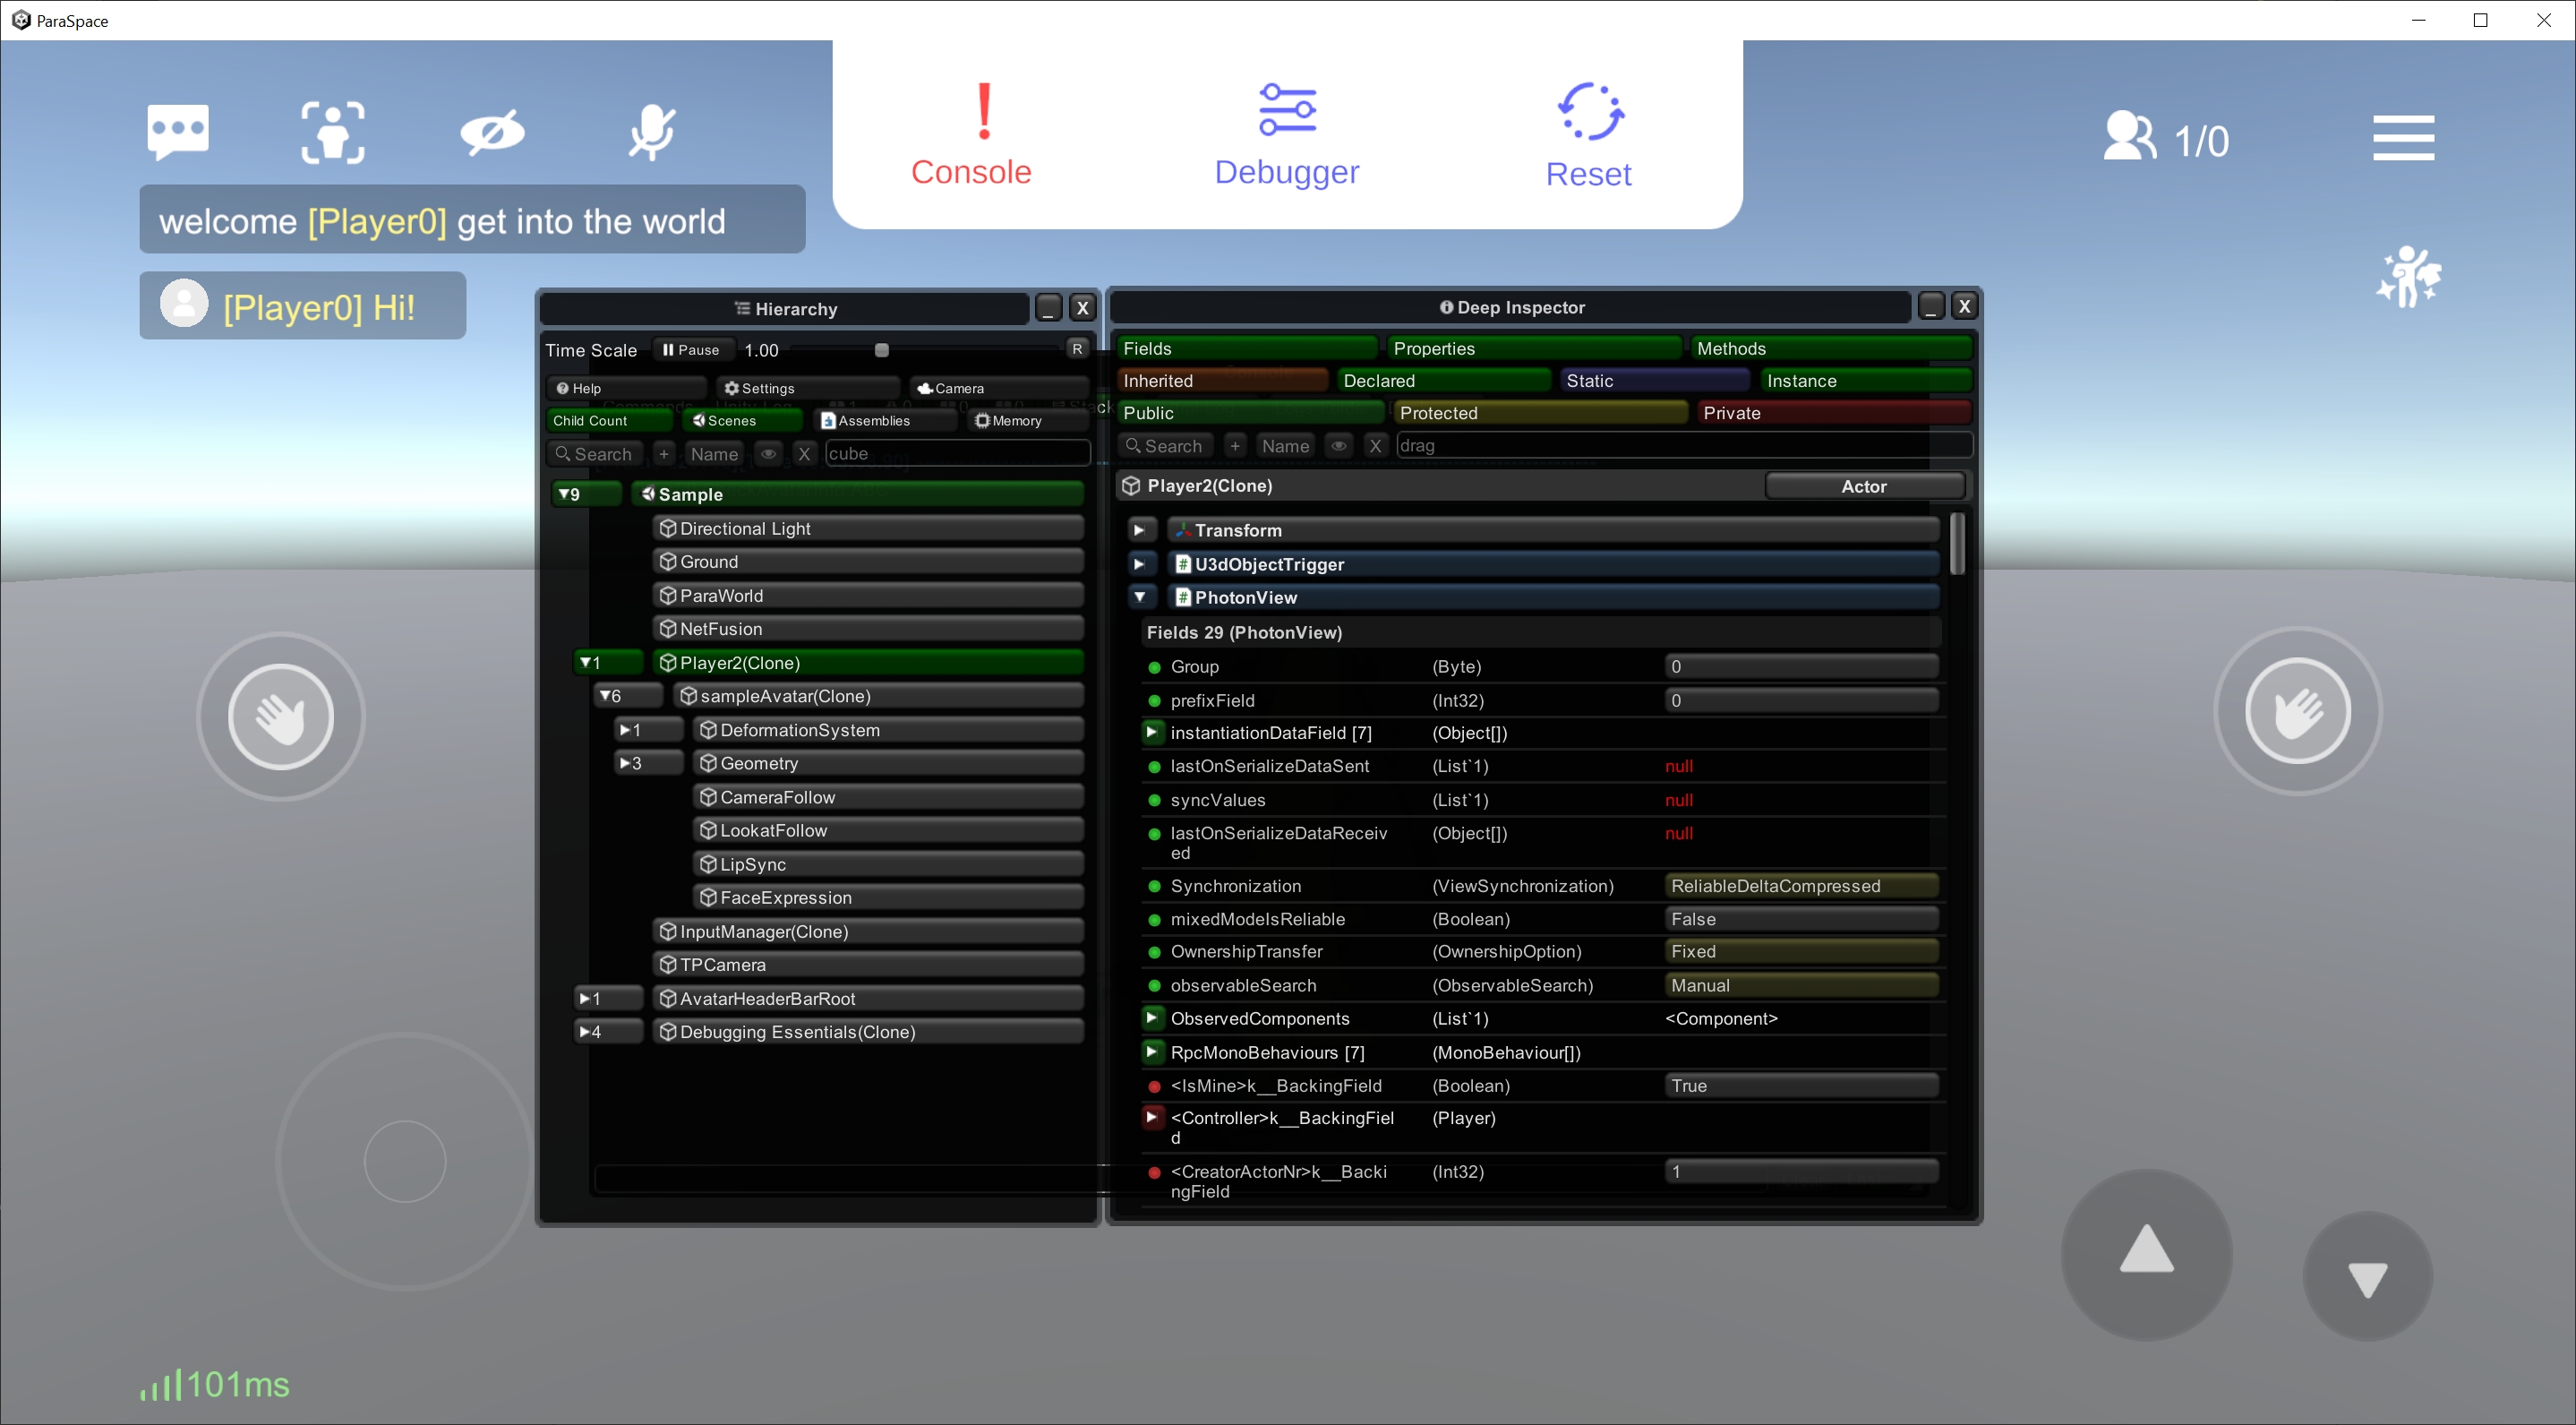
Debugger
Click "Debugger" to open the scene’s node controller.
On the interface, you can view the information about all nodes in the scene and monitor and modify the parameters in their scripts.
- This is an advanced feature. If you make parameter changes suddenly, an error may occur to the scene or Avatar.
Reset
The Reset feature, similar to that of the mobile platform, will restore your Avatar to the Spawn Point and reset the whole testing scene.
Updated about 1 year ago